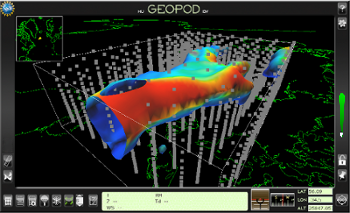
The Geopod interface was carefully designed to be simple and intuitive, presenting necessary features with a minimum of distraction. The main parts of the Geopod interface are described below.
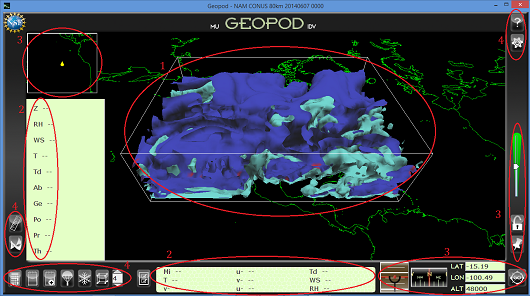
- Main viewing area allows plenty of room for users to examine isosurfaces in the data volume.
- Parameter display at the bottom of the screen holds up to 9 parameters; optional overflow panel displays up to an additional 10. Users can drag and drop parameter entries to create whatever custom arrangement they find most convenient.
- Navigational instruments assist users as they fly Geopod through the data volume. See the Navigation section below for details.
- Buttons allow access to additional functionality. See the Devices and Additional Features sections for more details.
In addition to isosurface and parameter display, Geopod provides a number of useful devices that facilitate and enhance student’s exploration of the atmosphere. These devices allow students to gather additional data about atmospheric conditions or view existing information in different ways.
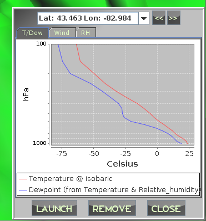 Dropsonde
This
device allows Geopod users to see a vertical profile of the
atmosphere at their current latitude and longitude. Users can view
graphs of temperature, dewpoint, relative humidity, u wind and v
wind plotted against pressure or, if they prefer, altitude. Geopod
maintains a customizable history of launched dropsondes which
users can cycle through to see how the graphs change at different
locations.
Particle Imager
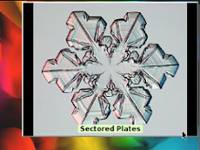 The
Particle Imager helps users explore the effects of temperature and
relative humidity on particle formation by displaying images of
the particles that could form under the conditions at their
current location. This device updates continuously; a changed
image alerts users that they have moved to a location with
different particle formation. Users can cycle also through several
particle images within the same particle formation category.
 Distance Calculator
The
Distance Calculator measures the straight-line distance between a
starting point and the Geopod’s current location. Updating
continuously as the Geopod moves, this device ensures that users
can always see how far away they are from when they started and
evaluate changes in parameter values accordingly.
Notepad and Note Location
System
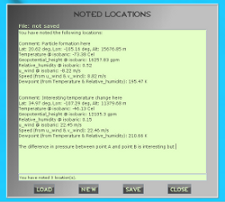
 The
Note Location System allows users to keep track of interesting
locations as they fly through the atmosphere. “Noting” a location
saves its lat, lon and alt along with the values of all the
parameters in the parameter display panel and an optional comment
in the Notepad. Users can later open the Notepad to see their
noted locations and add additional comments. The Notepad serves as
a mini-text editor: users can edit their notes, save them in a
.txt file, and open other .txt files from previous sessions all
inside Geopod.
 Gridpoint Visualizer
Geopod
and IDV use 3D gridded data sets, which means that data from
certain points in the atmosphere is interpolated to provide
information for every location in the data volume. The Gridpoint
visualizer helps users to understand this underlying dataset by
showing the locations where actual data was given. Using the
autopilot, users can easily fly to any of these gridpoints and see
the actual conditions there.
Flight Data Recorder and Flight Playback
The Flight Data Recorder allows users to maintain a record of their flight path and the activities, like launching dropsondes and noting locations, that they have performed at various locations. Then with the Flight Playback feature, users can be automatically taken back through their movements and activities to review exactly what took place during their exploration of the atmosphere.
In addition to navigational instruments and the devices described above, Geopod provides several additional systems that provide advanced features and allow users to customize their experience.
Parameter Chooser
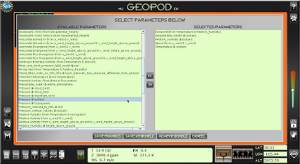 The
parameter chooser lets users decide which parameters they want
Geopod to display and update as they navigate through the
atmosphere. Users can select up to 19 of the over 50 parameters
available, ensuring that they have just the right information to
explore whatever meteorological concepts they choose.
 Isosurface Display
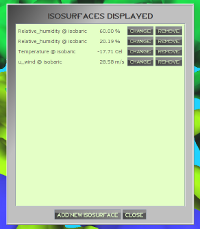
This
feature makes it easy to view, adjust, and remove the 3D
isosurfaces displayed in Geopod. Users can see what parameter was
used to create each isosurface, determine what constant value of
that parameter is being shown, change the parameter value, remove
the isosurface completely, or use a shortcut to the IDV interface
where they can access more advanced isosurface manipulation
options.
Help/Resource System
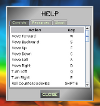
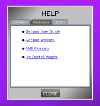
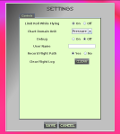 Settings Manager
Advanced
settings can be safely ignored by novice users but provide
advanced users with the flexibility to modify how navigation,
flight recording, the Dropsonde device, and other systems behave.
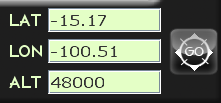
 Using
forward geocoding, Geopod users can to determine the city, state
or country over which Geopod is currently positioned. Reverse
geocoding, used in conjunction with the autopilot feature, allows
users to type in a place name and then fly there.
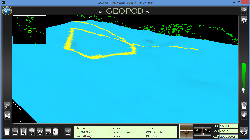
 The
Mini-map lets users easily see where they are in relation to the
rest of the world. Located in the upper left-hand corner of the
screen, the Mini-map displays a map of the world with a marker
indicating the Geopod’s current position. This is especially
useful if you are exploring a complicated isosurface and have lost
sight of the earth’s surface.


